VITUclim
Public viewer for Valencia's urban heat sensor network, designed and built on my own at the CEAM Foundation.
- My role
- Sole developer (design, backend, frontend and deployment)
- Date
- 2024 – 2026
- Stack
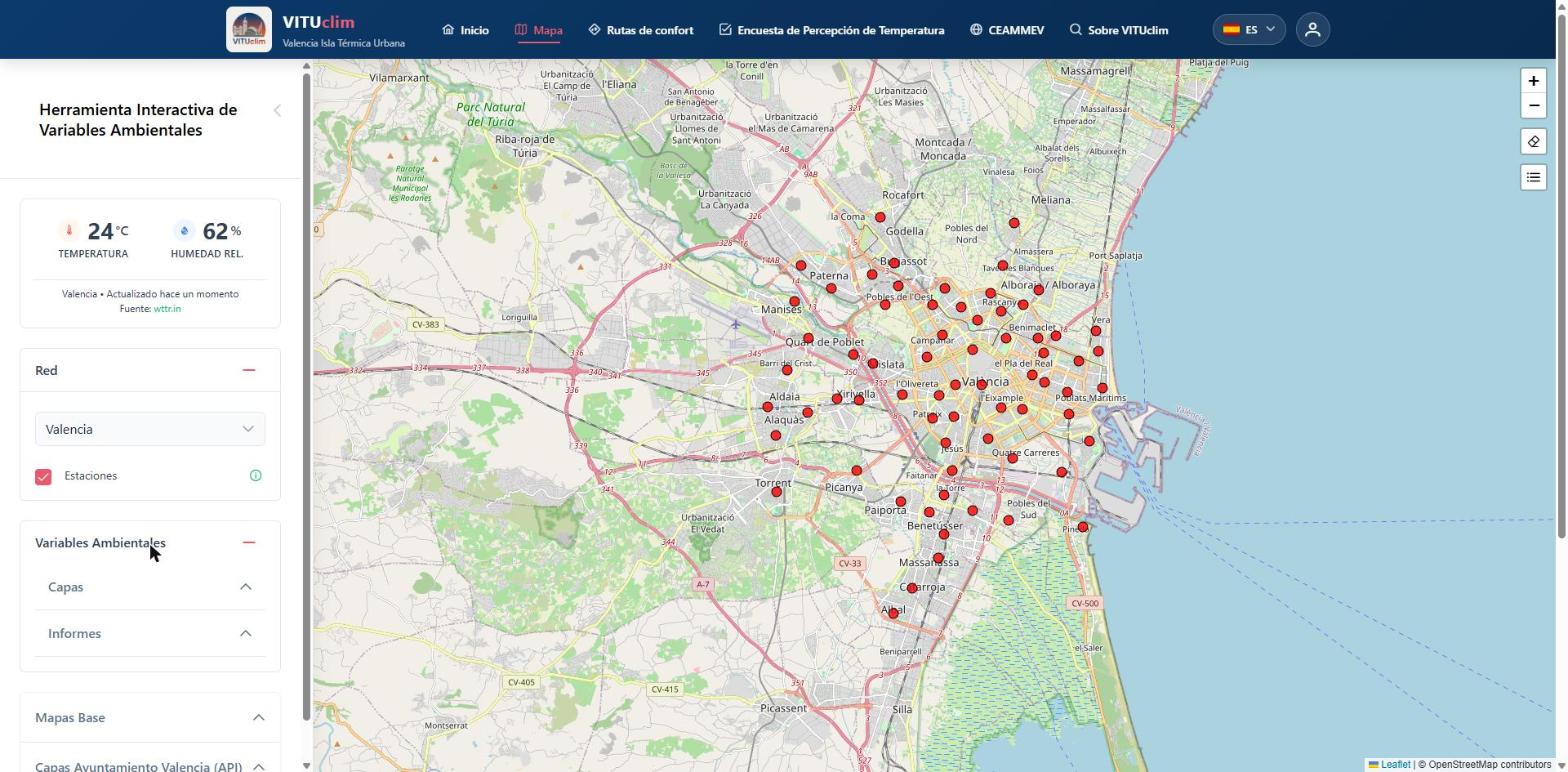
The problem
Conventional weather stations can’t capture how temperature changes from one neighbourhood to the next. The Meteorology and Climatology Area at the CEAM Foundation runs a network of temperature and humidity sensors across Valencia, its metropolitan area and Alzira to study the urban heat island. It needed a way to load, validate and show that data to researchers, the public and local authorities.
The solution
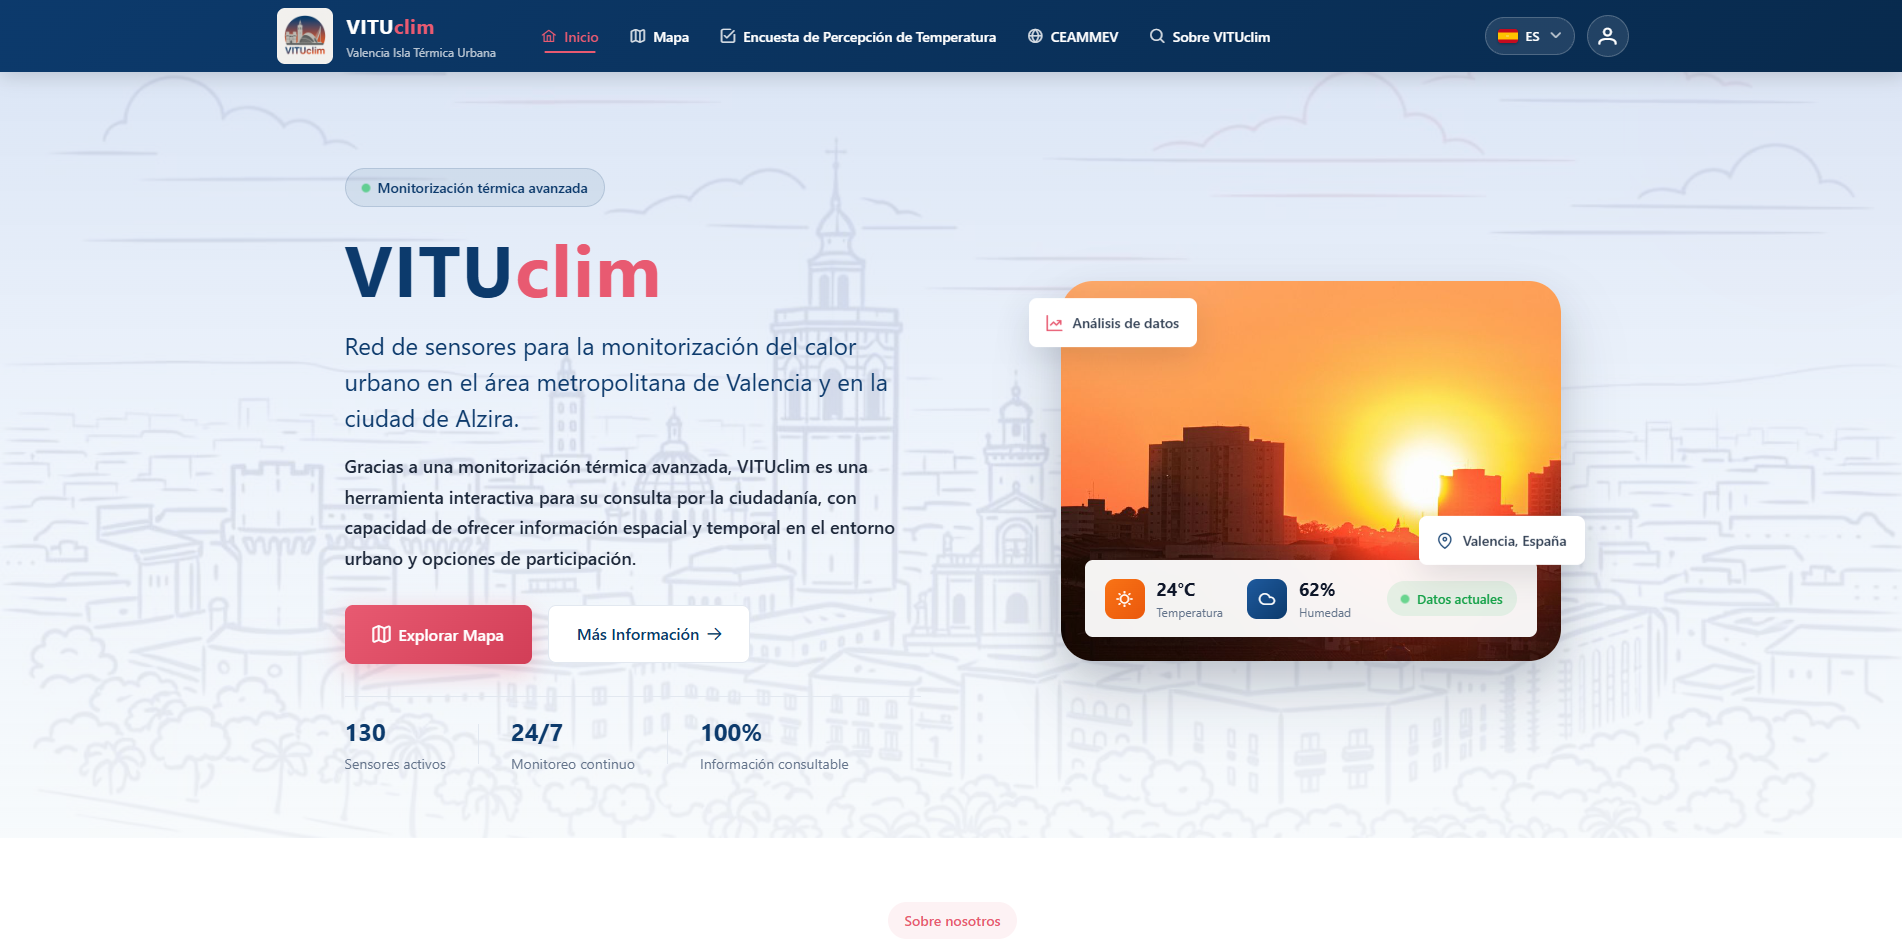
I designed and built VITUclim end to end:
- Backend with Django REST Framework and PostGIS to store and query each sensor’s time series and location.
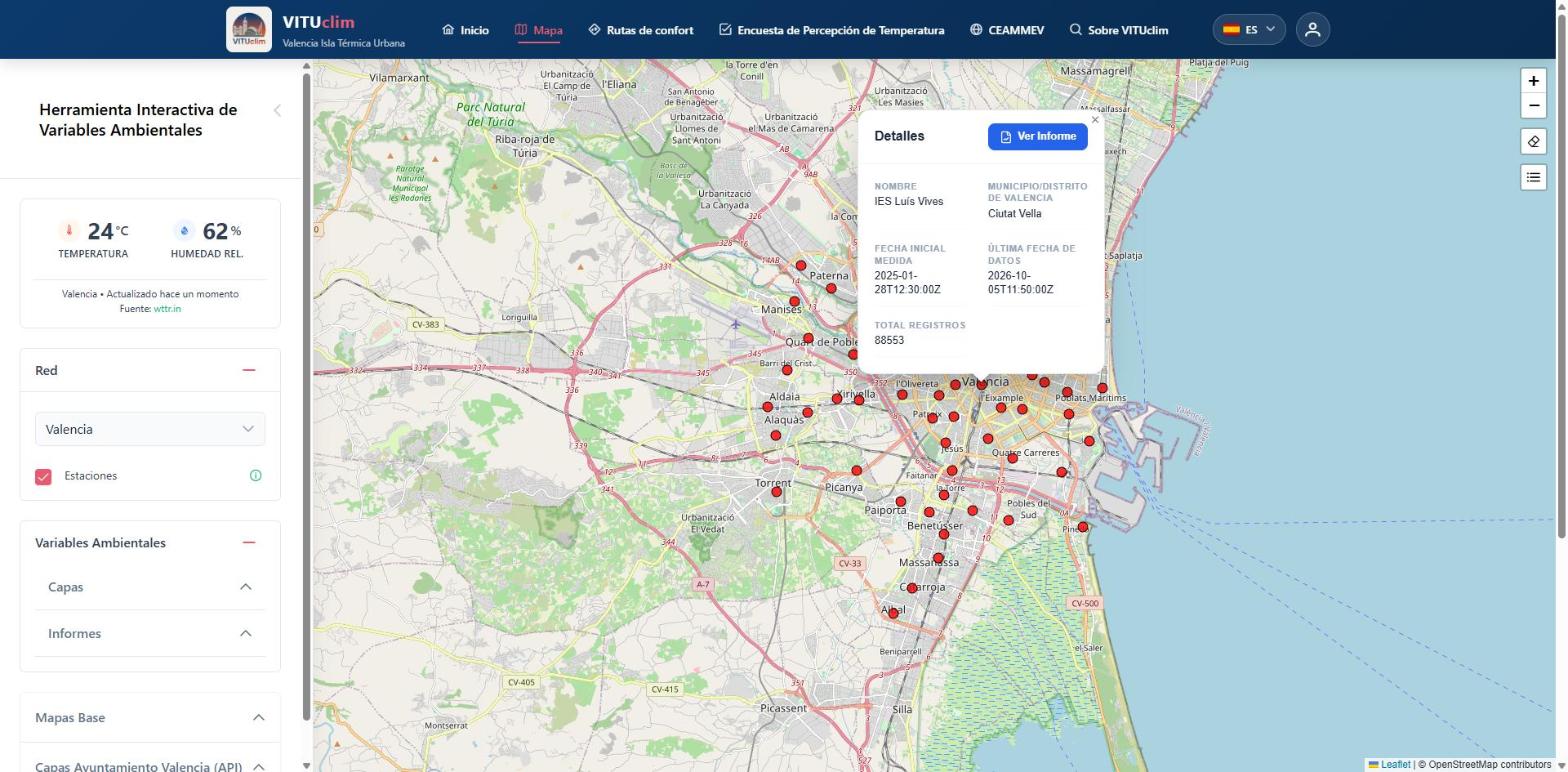
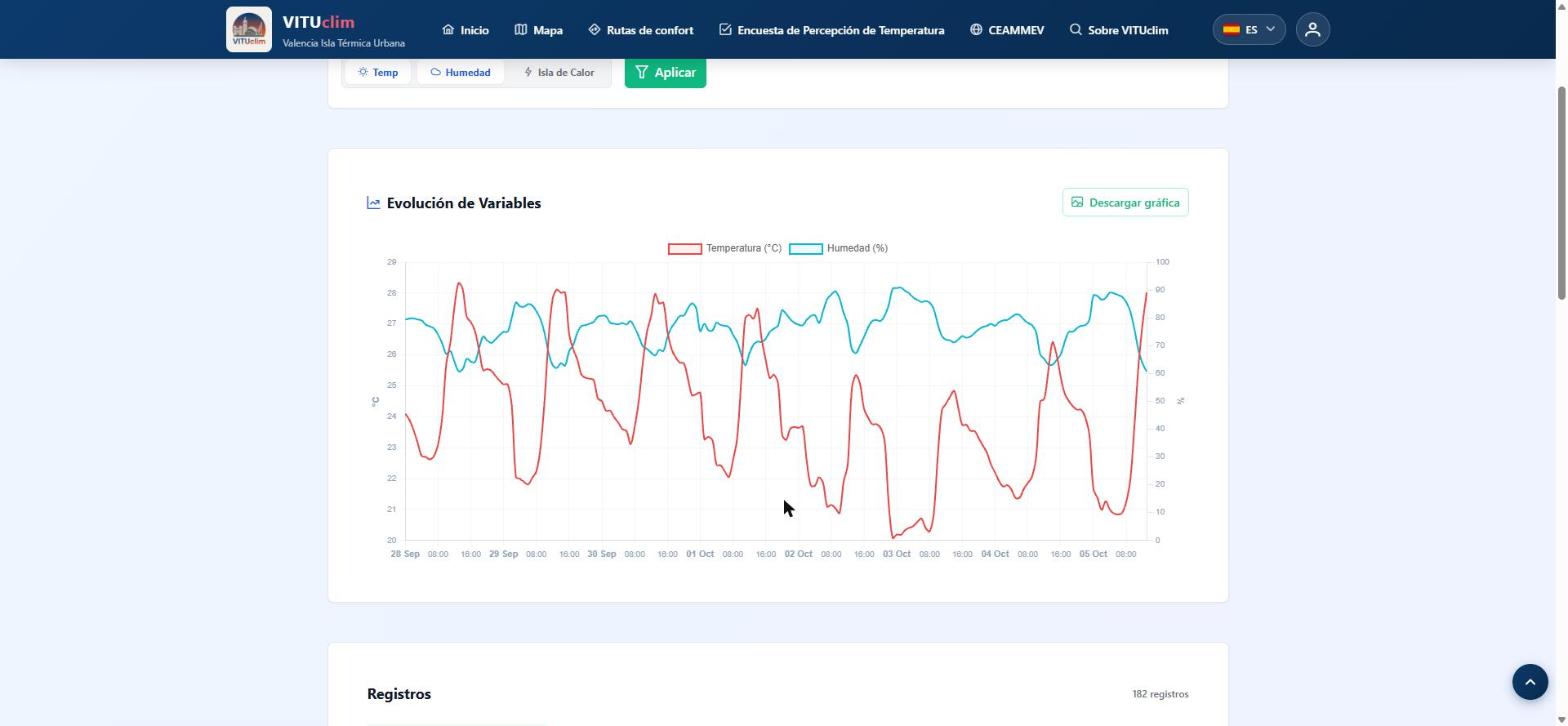
- Frontend in Angular with Leaflet maps: every sensor on the map, with its data and history.
- Data: loading and transforming historical data with pandas, plus a Python app for technicians to validate measurements before publishing them.
- Infrastructure: deployed with Docker and Nginx, with observability through Grafana, Loki and Prometheus, and load testing.
My role
I was the project’s only developer: I chose the architecture, built the backend, frontend and data tools, and deployed it. I worked closely with the research team to understand what they needed.
Outcome
- 130 active temperature and humidity sensors across Valencia and Alzira, one of the most detailed urban heat observation networks in Spain.
- An observability template for Django, extracted from this project and published as open source: django-loki-grafana-logging.